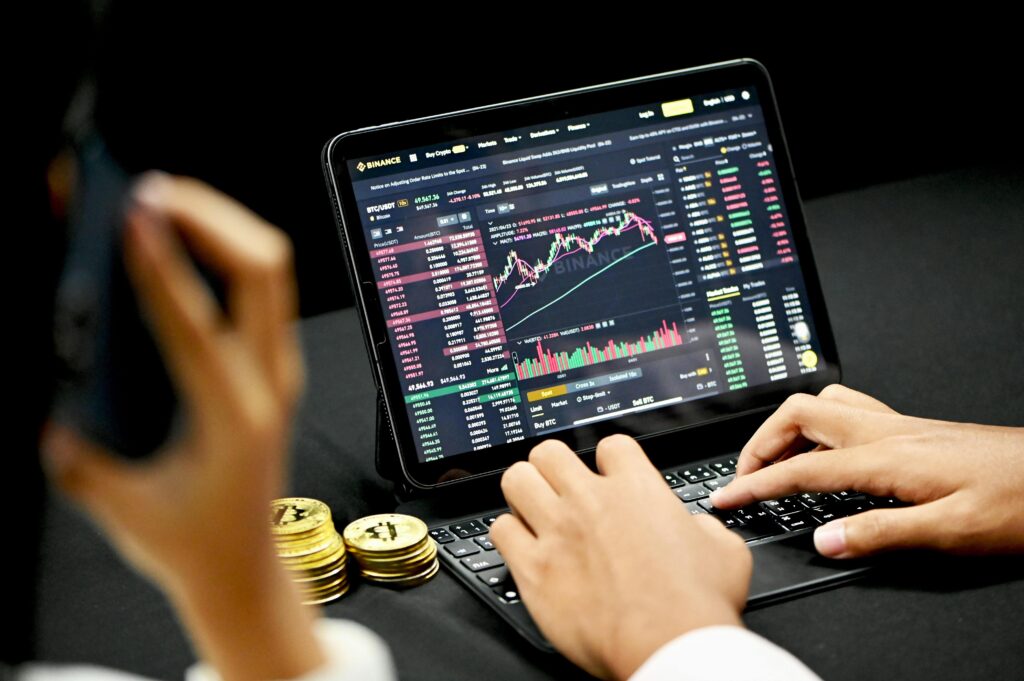


The Forex price action patterns sit at the heart of smart trading, helping you read crowd behavior and pick your spots with less guesswork. By watching pure price movement instead of leaning too much on lagging indicators, you can identify reliable setups in forex, stocks, indices, commodities, or cryptocurrencies on our CFD platform.
This step-by-step guide shares pro tips and real-world tricks so you can handle price action like a veteran, trade with calm confidence, and chase consistent gains even when the market flips fast.
Why Price Action Patterns Matter
Every price move tells a story, and candles, trend lines, support, and resistance show us that story in plain language. Trading this way slices through the noise, letting you tune in to what buyers and sellers are actually doing, which is priceless when markets swing wildly.
With price action as your compass, you can ride the trend, shrug off panic decisions, and use our sharp charting tools to zero in on chances from EUR/USD to Apple shares or Bitcoin.
Building a Price Action Framework
A Bulletproof plan begins with learning core shapes-like pin bars, islands, and double tops-and using them day in and day out so the patterns jump off the chart.
- Recognizing Core Candlestick Patterns
Candlestick patterns sit at the centre of price action trading. Traders watch for pin bars, tall wicks that show buyers or sellers were quickly turned away, and engulfing candles, which swallow the previous bar and hint at new momentum.
A classic example is a bullish pin bar forming near a support line on a 4-hour chart. It often points to a buying chance. By zooming in on daily or hourly charts, especially in forex or stocks, you can confidently catch clearer, more reliable shapes and trade.
- Identifying Support and Resistance Zones
Support and resistance levels are the backbone of price action, marking areas where price usually pauses, bounces, or sideways drifts. Support fills with buying pressure, while resistance holds back rallies. When you sketch these lines on a 4-hour screen, patterns like a double bottom resting on support pop out and suggest an upside move may follow. These outlines keep your entries sharp and your stops narrow, no matter what asset you follow.
- Price Action Patterns Across Markets
Every market spotlights different chances for price action trading, so fitting your method to stocks, futures, or crypto is key for bigger gains.
An Easy Guide to Forex Price Action Trading
Foreign-exchange markets are super liquid, making them a sweet spot for price-action traders. Pick pairs such as GBP/JPY when the London and New York sessions overlap, roughly from 8 a.m. to noon EST, and you usually see cleaner patterns.
One classic setup to watch for is a bullish engulfing candle appearing at the 50 percent Fibonacci retracement during an uptrend.
Key habits to strengthen your game include:
- Entering only after a pattern is confirmed, like a pin bar backed by solid volume.
- Skipping trades during low-liquidity hours to dodge fake signals.
- Snapping stop-loss orders just beneath key support levels as a safety net.
Stock and Index Price Action Trading
Stocks and index funds often react to earnings reports or sector buzz, so clean price-action clues show up when you pay attention. Upgrade your odds, for example, by waiting for Tesla to slice through a stubborn resistance band on a big, bullish candle before pulling the buy trigger.
When staring at an index such as the NASDAQ, look to trade pullbacks to familiar support zones, using contracts-for-difference, or CFDs, for extra flexibility. Always confirm whatever pattern you spot with a spike in volume, since that extra fuel shows the momentum is really behind the move.
Crypto and Commodity Price Action Trading
Digital coins such as Solana and raw goods like oil often swing wildly, making them perfect for traders who hunt for clear patterns. You might spot a double top at a Bitcoin resistance level, then wait for a bearish engulfing candle to confirm the trade.
With commodities, watch for headline-driven setups, like a gold breakout that sometimes follows new inventory numbers.
Reliable strategies include:
- Setting tight stop-loss orders to limit losses when the market turns against you.
- Looking for high-volume closes to back up any pattern you plan to trade.
- Aiming for quick exits at nearby resistance, securing gains before momentum fades.
Key Price Action Pattern Signals
Here is a quick look at some of the most reliable price action patterns traders watch for:
| Signal | Description | Why It Matters |
| Pin Bar at Support | Long wick that pushes off a support level. | Shows a strong chance of reversing up. |
| Engulfing Candle | One big candle swallows the previous one. | Marks a possible momentum shift for entry. |
| Double Bottom/Top | Price hits the same level twice, making a curve. | Hints that the trend may reverse or keep going. |
| Inside Bar Breakout | The small candle finally breaks the wider range. | Signals the end of sideways chop and a move. |
Executing Price Action Trades
Trading these patterns works best when you stick to a plan. Only pull the trigger after you see the signal, like that pin bar closing at support with volume backing it. Place your stop a bit past the recent swing, risk only 1%-2% of your account–
📌Note:
Spend time on a demo account to train your eyes, and use our live charts to spot each pattern with confidence.
- Advanced Price Action Techniques
Once you know the basics, you can sharpen your price-action game with a few extra tools. First, look for confluence: when a candlestick pattern lines up with a Fibonacci level or a solid trend line, take that signal more seriously.
Next, use multi-timeframe charts. For example, check the 15-minute view and then the daily to see if both agree with the same direction. Take a glance at the volume profile to spot busy price zones, helping you time your entry more confidently.
None of these extras are foolproof, and they do take practice, but they can lift your hit rate noticeably.
- Managing Risk with Price Action
Almost every trader will tell you that smart risk management keeps you in the game longer than talent alone. Start by limiting risk to 1% or 2% of your total account on any single trade. This way, one loss won’t wipe you out.
💡Tip:
Adjust your stop-loss distance based on how wild an asset usually moves-wider stops are often needed for things like crypto.
Take a few minutes each week to skim your trade journal and check if the patterns you followed were paying off or need tweaking. Stick to these habits and you will remain disciplined, even when the market gets rough.
- Overcoming Price Action Challenges
Even the sharpest charts occasionally throw you a curveball candle looks like a breakout, then flips back on itself. To fight that, wait for confirmation before jumping in. A strong close or an RSI divergence can signal that the move is real.
Keep an eye on volatility. When commodities or forex pairs swing wildly, be ready to widen your stop. Get comfortable with your charting platform so you don’t miss-click an entry, and continuously scan news and sentiment to sense shifts that could weaken your favorite setup.
The Final Verdict:
Learning the Forex price action patterns lets you read the market like a story, helping you enter and exit trades with greater confidence. When you spot candlestick signals, respect areas of support and resistance, and pair those insights with careful risk controls, you can make these patterns work for you in any market around the world.
We wish you the best of luck in your trading journey!
Popular Posts